Mapping different data sets from a country – with bright colours and click-through functions – may be a visual delight for developers and the tech-savvy, but what do these maps offer those crafting public policies? After all, the point of open data is to make more accountable and effective decision-making – whether it is about the public services to deliver, budgets to allocate or corruption risks to address.
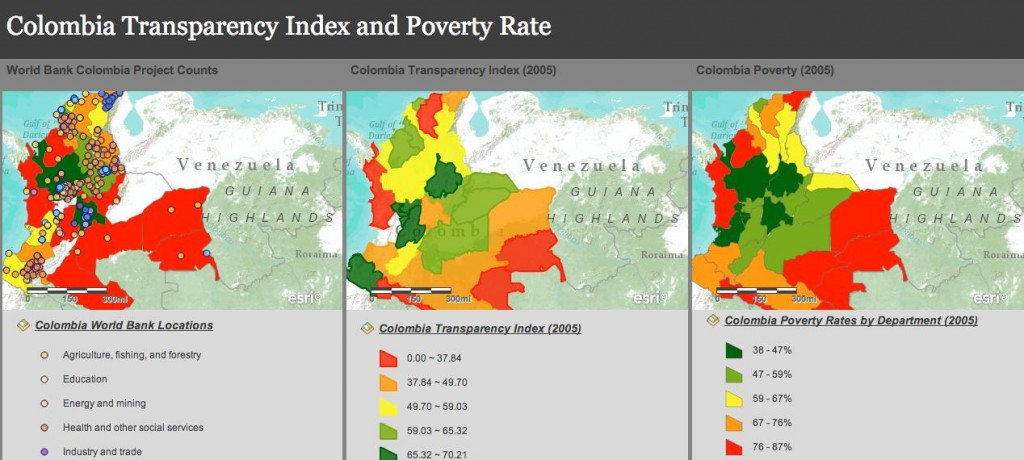
In the case of Colombia, Development Gateway and Transparencia por Colombia (the local chapter of Transparency International) have visually mapped data on development projects, transparency at the local level and poverty rates in Colombia to start to unravel this policy conundrum. While the data is backward looking on projects (2005), it gives us a sense of snap-shot in time – and better sense of how decisions must be made today.
With a couple of taps on your mouse, you can zoom in – both literally and metaphorically – on what is happening in each of the country’s 32 administrative departments on these three issues. In looking across the three maps, the traffic-light coloured scale shows that higher rates of poverty and lower levels of transparency (and higher corruption risks) often follow together. This trend supports what Transparency International has been arguing – poverty and corruption are highly correlated and the poor pay more when it comes to the problem.
The map’s data draw on publicly available information provided by the World Bank on its activities, the integrity index produced by the TI chapter in Colombia and poverty data from the Inter-American Development Bank. With the World Bank’s data, you can even click on the multi-coloured points (classified by sector) to find out more about the projects (although there are information gaps on the total funding for some projects).
There are two surprises that jump out from the maps.
First, World Bank projects – such as on education and water and sanitation – are not found in large swaths of the country that suffer from some of the highest poverty rates. Before drawing too quick of conclusions, another data layer is needed to know where most of Colombia’s poor live in absolute numbers (by combining population levels with poverty rates) to see whether development funding is being channeled to the most underprivileged areas.
Second, you would also think that good governance initiatives would be happening in the areas with the worst levels of transparency and accountability. After all, findings show that where corruption is high, it correlates with lower education, health and sanitation outcomes.
In fact, there is a dearth of World Bank projects in Colombia related to rule of law, the judiciary and the public sector. World Bank-backed good governance initiatives are absent in areas where corruption risks for the department are high and where it is funding other numerous projects related to corruption-prone sectors, such as transport and large-scale infrastructure projects.
The increasing availability of local level data on anti-corruption indicators and development projects (including from the World Bank) allows us to start flagging these information mismatches.
Still the question remains: will the World Bank and the Colombian government use these findings to begin re-evaluating how their policy decisions are made today?


 Connect with us on Facebook
 Follow us on Twitter