
The Corruption Perceptions Index, the annual index of perceived levels of public sector corruption around the globe, enters its 20th year of publication this year.
Over the past two decades, the index has become one of the key corruption indices worldwide. There is a Harvard case on it and it has even been used as a performance indicator by the Malaysian government. This is largely because the Corruption Perceptions Index highlights and raises awareness of corruption in simple terms – a single number to denote the level of corruption in a given country, a rank to compare the country with its peers coupled with global coverage of more than 170 countries. This way, a complex and at times abstract concept is translated into something that people can relate to. For me and my colleagues at Transparency International, the index usually gives a good entry point for a personal discussion about corruption with people from all walks of life in the countries we visit, from taxi drivers to bureaucrats.
The index is a composite index that aggregates data from up to 12 different data sources into a single score. Any index that captures corruption through a single score will have its shortcomings. Therefore, not surprisingly the Corruption Perceptions Index has received its fair share of criticisms over the years, some of which can be read here, here and here. Let’s review some of the most important debates:
1) The index is underpinned by an unclear and limited definition of corruption
The Corruption Perceptions Index focuses on corruption that involves public officials, civil servants or politicians thereby shining a spotlight on the public sector. The data sources used to compile the index include questions relating to the abuse of public power and focus on: bribery of public officials, kickbacks in public procurement, embezzlement of public funds, and the strength and effectiveness of public sector anti-corruption efforts. The index score therefore provides a reflection on the general state of corruption as faced by ordinary people as well as businesses in a country. While this is a rather broad definition of corruption, it has a distinct strength in that it includes various forms of corrupt practices. Simply put, an overall measure of perceived levels of corruption across countries can only work with a broad definition. Even such a broad definition, however, does not – and we would argue – cannot include all forms of corruption. For example, the role of major financial centres in helping the corrupt to enjoy their proceeds from corruption or the role of multinational companies in bribing when doing business abroad cannot be captured by the Corruption Perceptions Index. Therefore, it is important to highlight that the index is not the be all and end all of corruption measurement, and one needs several research tools and data points to get a full picture of corruption in a given country.
2) The Corruption Perceptions Index relies on the perception of experts rather than measuring actual corruption experiences
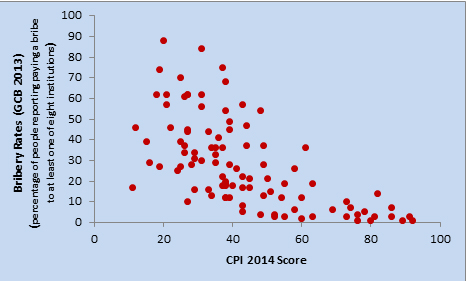
All the Corruption Perceptions Index data sources measure perceptions of corruption, which raises the important question whether these perceptions somewhat approximate “real experiences” with corruption. Over the years, the index scores have correlated fairly well with bribery rates obtained through Transparency International’s Global Corruption Barometer surveys (see graph).
And a perfect correlation between measures of street-level bribery and the Corruption Perceptions Index should not be expected in any case since the index measures more than just bribery and includes other corrupt practices, such as nepotism, kick-backs and influence-peddling.
3) The experts are often based abroad leading to a foreign elite bias particularly for poor countries
The Corruption Perceptions Index indeed largely captures the opinions of internationally focused experts, typically from a corporate background and/or with higher education levels. However, there is no robust evidence to suggest that this leads to a foreign elite bias.
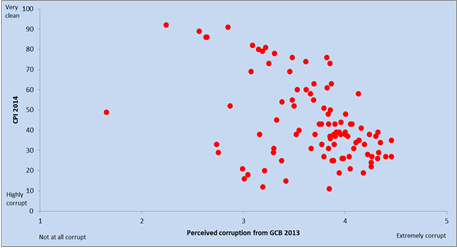
If we use bribery rates as a proxy for corruption as experienced by ordinary people, the correlation coefficient between the 2014 Corruption Perceptions Index scores and bribery rates from our 2013 Global Corruption Barometer is -0.64, denoting a close relationship between expert perceptions and the reality for people on the ground. Further, perceptions of the general public[1] as reported in the 2013 barometer and the perceptions of experts from the 2014 index seem to be quite well-aligned (see graph): in most countries where experts and business analysts perceive corruption to be an issue, the general public seem to see it the same way.
4) The Corruption Perceptions Index is not really comparable over time – so no real policy implications can be derived from the index
The index methodology was updated in 2012 to rectify this weakness. Even the scale of the index was changed from 0-10 to 0-100 in order to communicate the change in methodology clearly. However, the comparability of index scores is still debated. The main argument being that the underlying data sources may not be comparable over time due to factors such as implicit relative comparisons, change of experts from year to year and addition or subtraction of countries to the lists. All these are valid concerns and deserve discussion.
Transparency International uses several criteria for choosing data sources for the index, one of them being cross-country comparability of data over time. For a source to be incorporated into the Corruption Perceptions Index, the data should measure the same thing on the same scale in each country and should be repeated over time.
The index data sources provide their experts with clear guidelines for rating countries in order to minimise bias arising due to change in experts or inclusion/exclusion of countries from their list. The experts’ ratings are in all cases peer reviewed. In addition, Transparency International can seek explanations from the data sources to provide evidence or reasons for significant changes in scores from one year to another.
While there will always be noise and bias in any measurement of complex social phenomena, such as corruption, we think we employ international best practice standards to ensure robust cross-country data and minimise any potential biases.
5) The Corruption Perceptions Index does financial harm – countries scoring poorly on the index get punished by donor agencies and/or investors reducing aid and investment
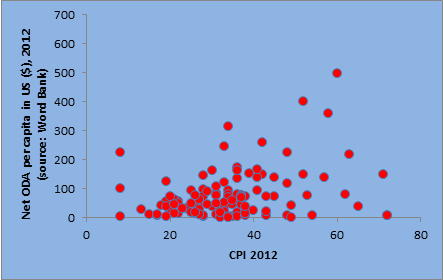
The index is often used as an indicator for ascertaining relative corruption levels by donor agencies and private investment firms. For example, the Millennium Challenge Corporation uses the index as supplementary information to make decisions regarding eligibility of countries for funding. Similarly, the Corruption Perceptions Index came out to be most used information source for assessing country risk by compliance officers as reported in a survey carried out Dow Jones. However, it is not the sole indicator used by companies to assess risk and is often supplemented with other expertise. Additionally, evidence shows that across countries the levels of overseas development assistance received by a poor country are unrelated to its Corruption Perceptions Index score (see graph).
Two decades since the first Corruption Perceptions Index, public sector corruption continues to remain a challenge in a majority of the countries around the world. Through the index we at Transparency International continue to highlight the problem of public sector corruption and raise awareness of its negative impact on people’s lives.
The index has served us and the larger anti-corruption community well as it raises public awareness about the scourge of corruption worldwide and invites debates on what needs to be done to stop it.
In spite of its shortcomings, over the years the Corruption Perceptions Index has provided Transparency International with entry points for dialogue and discussion with government, private sector, and citizens on how to best tackle corruption. The index itself does not offer policy solutions or quick fixes for corruption. However, it offers a metric that people can rely upon to get a sense of the overall corruption environment in countries across the world.
With 20 years of corruption ranking under its belt, it’s safe to say that the Corruption Perceptions Index has helped to bring conversations around corruption from behind closed doors to taxis, restaurants and the public arenas of the world. For a lean research product consisting of a set of numbers this is not a bad performance, I would argue.
[1] To understand the alignment between perceptions, we considered the average score for public perceptions of corruption in five public institutions covered by the 2013 Global Corruption Barometer: political parties, parliament/legislature, police, judiciary, and public officials, where the following question was posed: “to what extent do you perceive the following institution/sector to be affected by corruption?”.


 Connect with us on Facebook
 Follow us on Twitter